Splunk Connect for Kubernetes: ‘reading’ stacktraces in your pod.

Featured

Within our Openshift cluster, we use one main application based on Java. The Splunk Connect for Kubernetes integration worked pretty well out of the box, as all our pods are now logging to Splunk. There is just one problem: The Fluentd log forwarder simply reads your logs and forwards them to Splunk without interpretation. In this blogpost I’ll explain how we had to tune the fluentd configuration to handle stacktraces and how this was configured in the Helm chart you use to install the Splunk Connect in the first place.

By default, the Splunk Connect for Kubernetes integration grabs every pod log and forwards it to Splunk. Splunk then interprets these messages and generates ‘events’ for each line. This is fine when every line in your log has it’s own meaning. For example, look at the example below to see a webserver access.log which states on each line which webpage was requested, how it was handled and so on

192.168.2.20 - - [28/Jul/2006:10:27:10 -0300] "GET /cgi-bin/try/ HTTP/1.0" 200 3395
127.0.0.1 - - [28/Jul/2006:10:22:04 -0300] "GET / HTTP/1.0" 200 2216
127.0.0.1 - - [28/Jul/2006:10:27:32 -0300] "GET /hidden/ HTTP/1.0" 404 7218

In this example each line is an event on it’s own, as they represent different requests to different web pages. These events show up in Splunk as separate ‘events’ as well.

multiple Splunk events, one for each access.log line

However when you have a Java stacktrace, the message gets pushed on to multiple lines:

2021-08-30T09:45:08,525 ERROR [org.springframework.web.context.ContextLoader] (ServerService Thread Pool -- 74) Context initialization failed: [...]
	at org.springframework.beans.factory.support....
	at org.springframework.beans.factory.support.ConstructorResolver...
	at org.springframework.beans.factory.support.AbstractAutowireCapableBeanFactory...
	at org.springframework.beans.factory.support.AbstractAutowireCapableBeanFactory...

And this results in each line becoming an individual ‘event’ in Splunk:

As you can imagine, this makes it very difficult to read the logs and also to search for any errors. To solve this, you have to use a feature called ‘multiline‘. This feature recognises the start of an event and stiches all lines together (using concat) untill the beginning of a new event is found. To do this, Fluentd needs to recognise the start of an event. In the example above, we know that the java (EAP7) log looks like this:

2021-08-30T09:45:08

To figure out the proper filter (which can be a trial-and-error process) you can add the following filter in the configmap splunk-kubernetes-logging in your splunk-logging namespace.

<filter tail.containers.var.log.containers.my-application-name-*.log>
    @type concat
    key log
    timeout_label @SPLUNK
    stream_identity_key stream
    multiline_start_regexp /^\d{4}-\d{2}-\d{2}T\d{2}:\d{2}:\d{2},\d{3}\s/
    flush_interval 5
    separator "\n"
    use_first_timestamp true
  </filter>

The filter starts with the tail.containers.var.log.containers. line where you can specify the name of the logfile generated by your pod. This way the multiline filter will only work on the output of your pod.

Inside the filter you can see the type concat which means that fluentd will stitch lines together. The multiline event is recognised by a regular expression, which matches the timestamp at the start of the stacktrace. In the example above, this is format 2021-08-30T09:45:08

In our case we needed the timeout_label @splunk to prevent fluentd to hit an error:

#0 dump an error event: error_class=ThreadError error="deadlock; recursive locking"

This prevented fluentd from uploading the stacktrace entry to Splunk. When the multiline filter works, all lines from the stacktrace are stitched together as one line and they appear in Splunk as a single event:

stacktrace on a single line, some sensitive logentries are removed

Even though it’s much easier to search for errors this way, the log entry is still very unreadable. To fix this, use the seperator “\n” to tell Splunk to reconstruct the linebreaks. The result looks like this:

properly formatted stacktrace, some sensitive logentries are removed

Great, your Java stacktraces appear as normal stacktraces in Splunk and you’re done right?
Unfortunatelly, Helm doesnt know that you changed the configmap inside openshift so whenever you install a newer version of the helm chart, all your progress is overwritten.


To fix this, simply head over to your helm chart and replace

customFilters: {}

to:

  customFilters:
    My-first-StacktraceFilter:
      tag: tail.containers.var.log.containers.my-application-name-*.log
      type: concat
      body: |-
        key log
        timeout_label @SPLUNK
        stream_identity_key stream
        multiline_start_regexp /^\d{4}-\d{2}-\d{2}T\d{2}:\d{2}:\d{2},\d{3}\s/
        flush_interval 5
        separator "\n"
        use_first_timestamp true

And that’s it! Whenever you install your helm chart the customFilter is automatically added to the configmap.

Featured

Setting up Splunk Connect for Kubernetes on Openshift 4.x with Helm

As part of our daily operations, our team and our customers use the company-wide Splunk application. Splunk is used to search through application logs and check the status of file transfers. So naturally when we were moving our application to Openshift, one of the main prerequisites was to set up all container logs to Splunk. This required a bit of digging, as the Splunk team usually installed an agent on our Linux hosts and configured the agents to pick-up the logs we want to add. In the world of pods where containers can live very briefly, installing such agents would never work. Luckily for us we could rely on Splunk Connect for Kuberetes.

The concept of this project is rather simple: a helm chart is generated where you can tweak any Splunk-specific forwarders you wish. Out of the box there are 3 components available:

  • splunk-kubernetes-logging – this chart simply configures Splunk to read all container (stdout) logs, usually this is the only one you’ll really need. Installing this chart will result in a daemonset of forwarders (each node gets one) and all crio logs from that node are forwarded to Splunk.
  • splunk-kubernetes-objects – this chart will upload all kubernetes objects, such as creation of projects, deployments etc. Installing this chart will result in a single objects pod which talks to the api.
  • splunk-kubernetes-metrics – a specific metric chart, just in case you’d rather use Splunk metrics instead of the built-in Grafana. Installing this chart will also create a daemonset.

For each of these charts you can set the Splunk host, port, certificate, HEC token and index. This means you can use different indexes for each component (e.g. a logging index for users and an objects index for the OPS team). This blog assumes that your Splunk team has created the required HEC tokens and Indexes which will be used in the Helm chart.

To start, create a new project where all Splunk forwarders live. This is quite simple:

oc new-project splunk-logging --description="log forwarder to Company-wide Splunk"

If you work with infranodes on your cluster and adjusted your default cluster scheduler to ignore infranodes, by default no Splunk forwarders will be installed there. This might be exactly what you’d want, but if you also want Splunk forwarders on these nodes, type:

oc edit project splunk-logging 

and add

openshift.io/node-selector: ""

The next part is a bit scary: Splunk logging forwarders simply look at the filesystem of the Openshift worker (specifically at /var/log/containers/ ) as this is the default location where CRI-O logs are stored in Openshift. There is no ‘sidecar’ approach here (an additional container on each of your pods) to push logs to Splunk.

It is a straightforward approach, but of course pods are not allowed to go on the worker filesystem out of the box. We’ll need to create a security context to allow this inside the splunk-logging namespace.

--- contents of scc.yaml ---
kind: SecurityContextConstraints
apiVersion: security.openshift.io/v1
metadata:
name: scc-splunk-logging
allowPrivilegedContainer: true
allowHostDirVolumePlugin: true
runAsUser:
type: RunAsAny
runAsUser:
type: RunAsAny
seLinuxContext:
type: RunAsAny
volumes:
- "*"

Note the ‘allowPriviledContainer: true’ and ‘allowHostDirVolumePlugin: true’ which allows (privileged) Splunk pods to look on the worker filesystem. Setting up the scc is only half the puzzle though, you’ll need to create a Service Account and map this to the security context.

oc apply -f ./scc.yaml
oc create sa splunk-logging
oc adm policy add-scc-to-user scc-splunk-logging -z splunk-logging

Next, get the helm binary and run

helm repo add splunk https://splunk.github.io/splunk-connect-for-kubernetes

If your bastion host cannot go to splunk.github.io like due to a firewall policy, you can download the Splunk-connect-for-kubernetes repository here in .tar.gz format and use:

helm install my-first-splunk-repo splunk-connect-for-kubernetes-1.4.9.tgz

Great, now you’ll need a chart to tweak into. To generate the chart, type

helm show values splunk/splunk-connect-for-kubernetes > values.yaml

Note: the values.yaml is generated based on the repository. You can tweak this file as much as you want, but please know that the values are based on the repository version you are currently using. This means that the accepted values in the helm chart might change over time. Always generate a vanilla chart after upgrading the splunk-connect-for-kubernetes repository and compare to your specific helm chart to the new template.

Your values.yaml will have 4 sections: a ‘global’ section and the 3 component section listed above. At the global section you can set generic values such as Splunk host, Splunk Port, caFile and Openshift clustername. At each specific section you can set the appropriate HEC token and Splunk index. The helm chart is too large to discuss here, but some words of advice:

  • To disable a section, simply set enabled: false, e.g.
splunk-kubernetes-objects:
enabled: false
  • Your pods will need to run with privileged=true. Use this in each of the components, it doesn’t work in the ‘global’ section of the helm chart
# this used to be: openshift: true 
securityContext: true 
  • you’ve already created the serviceaccount with the mapped scc, so make sure Helm uses it:
serviceAccount:
  create: false
  name: splunk-logging
  • The default log location of Openshift is /var/log/containers, so you’ll need to set this in each section:
fluentd:
  path: /var/log/containers/*.log
  containers:
    path: /var/log
    pathDest: /var/log/containers
    logFormatType: cri
    logFormat: "%Y-%m-%dT%H:%M:%S.%N%:z"
  • if you don’t want all the openshift-pod stdout logs (which can be a HUGE amount of logs), exclude them like this:
exclude_path:
  - /var/log/containers/*-splunk-kubernetes-logging*
  - /var/log/containers/downloads-*openshift-console*
  - /var/log/containers/tekton-pipelines-webhook*
  - /var/log/containers/node-ca-*openshift-image-registry*
  - /var/log/containers/ovs-*openshift-sdn*
  - /var/log/containers/network-metrics-daemon-*
  - /var/log/containers/sdn*openshift-sdn*
  • if you don’t want all the etcd and apiserver logs, remove this line so no forwarder pods are installed on the masternodes:
  tolerations:
#    - key: node-role.kubernetes.io/master
#      effect: NoSchedule

If you’re happy with the helm chart (which can be very trial-and-error), simply type:

helm install my-first-splunk-repo -f your-values-file.yaml splunk/splunk-connect-for-kubernetes

$ or in an offline environment:

helm install my-first-splunk-repo -f your-values-file.yaml splunk-connect-for-kubernetes-1.4.9.tgz

If your chart is valid, you’ll see something like:

Splunk Connect for Kubernetes is spinning up in your cluster.
After a few minutes, you should see data being indexed in your Splunk

to see the daemon set pods spinning up, simply type

watch oc get pods -n splunk-logging

In case you want to make more changes to the helm chart (for example to add more filters), you can always modify your values.yaml and then hit:

helm upgrade my-first-splunk-repo  -f your-values-file.yaml splunk/splunk-connect-for-kubernetes

Helm will detect the change and only modify the affected parts. For example if you’ve added more logs to the exclude_path, helm will update the configmap containing the Fluentd config and then terminate the daemonset one-by-one.

That’s it for now, in the next blog I’ll show you how to add a filter that prevents Java Stacktraces to become multiple Splunk events!

How we installed Openshift 4.5 UPI with Static IP’s on VMWare

Featured

In this blogpost I’ll explain how we have set up Openshift 4.5 on a VMWare environment using the ‘User Provided Infrastructure’ installation method. Whereas Openshift 4,1 and 4.2 had mandatory requirements to set the network up using DHCP, version 4.3 was the first Openshift version to mention that static IP’s were possible. Unfortunately, the standard documentation doesn’t describe how this can be achieved. We used a hands-on approach adjusting the official ignition files for each node. As it turns out, a similar method was later described in a new support article from Red Hat. To indicate this was a real issue for several companies, the release notes for Openshift 4.6 even say that the new CoreOS OVA file contains an out-of-the-box approach for setting static IP’s, even though this isn’t described in the documentation yet.

Before we can explain how the static files are added to each node, you must understand how the installation of Openshift on VMware is achieved. First you download the Openshift-Installer binary which is used to generate ignition files. The Openshift-Installer expects an install-config.yaml, a simple configuration file where you enter the cluster name, pull secret (for subscriptions) etc. When the Openshift-Installer is finished, you’ll get 3 ignition files: one for bootstrap, one for masters and one for workers. Note that there is no dedicated ignition file for ‘infra nodes’, as these are simply workers with an additional label. To build your cluster, simply download the latest CoreOS OVA (a virtual disk), import it to VMWare and add corresponding ignition files as base64 encoded strings.

The VM should be connected to a vSwitch which connects to your company’s network. If you can manipulate the DHCP server of this network, the official documentation states you should set an indefinite IP Address to your VM’s MAC address. If you can do this, you’re all set. In our case, we had no direct access to the DHCP so we could not match the VM MAC address to an IP address. Instead, we used DHCP to get an initial IP and added a static IP file which was active after reboot. Unfortunately this means you always need DHCP to give you an initial IP Address (unless you use Openshift 4.6 or above).

To set a static IP for a VM, first we used the following template:

TYPE=Ethernet
PROXY_METHOD=none
BROWSER_ONLY=no
BOOTPROTO=none
IPADDR=__IP__
PREFIX=__PREFIX__
GATEWAY=__GW__
DNS1=__NAMESERVER1__
DNS2=__NAMESERVER2__
DEFROUTE=yes
IPV4_FAILURE_FATAL=no
IPV6INIT=yes
IPV6_AUTOCONF=yes
IPV6_DEFROUTE=yes
IPV6_FAILURE_FATAL=no
IPV6_ADDR_GEN_MODE=stable-privacy
NAME="ens192"
DEVICE=ens192
ONBOOT=yes
AUTOCONNECT_PRIORITY=-999

For each host we would fill in the variables (indicated with the double underscore) . As you can imagine, this turned out to be incredibly cumbersome for a lot of nodes, which is why we generated these files using a simple bash script. After the file for the specific node was created, we would simply base64 encode the file, using:

cat <filename> | base64 -w0

The output will look like this

VFlQRT1FdGhlcm5ldApQUk9YWV9NRVRIT0Q9bm9uZQpCUk9XU0VSX09OTFk9bm8KQk9PVFBST1RPPW5vbmUKSVBBRERSPTE5Mi4xNjguMC4xMApQUkVGSVg9MjQKR0FURVdBWT0xOTIuMTY4LjAuMQpETlMxPTguOC44LjgKRE5TMj04LjguNC40CkRFRlJPVVRFPXllcwpJUFY0X0ZBSUxVUkVfRkFUQUw9bm8KSVBWNklOSVQ9eWVzCklQVjZfQVVUT0NPTkY9eWVzCklQVjZfREVGUk9VVEU9eWVzCklQVjZfRkFJTFVSRV9GQVRBTD1ubwpJUFY2X0FERFJfR0VOX01PREU9c3RhYmxlLXByaXZhY3kKTkFNRT0iZW5zMTkyIgpERVZJQ0U9ZW5zMTkyCk9OQk9PVD15ZXMKQVVUT0NPTk5FQ1RfUFJJT1JJVFk9LTk5OQo=

If you’re not sure if the base64 encoding worked, or if you simply want to check the contents of a base64 string, just type

base64 -d <your_base64_string>

Now that we have the static IP configuration file set for the VM, it’s time to manipulate the default ignition files you’d get from the Openshift-Installer binary. If you look at these ignition files, you’ll see that they contain an empty “storage” section.

{
  "ignition": {
    "config": {
      "append": [
        {
          "source": "https://<your_internal_api_loadbalancer>:22623/config/worker",
          "verification": {}
        }
      ]
    },
    "security": {
      "tls": {
        "certificateAuthorities": [
          {
            "source": "data:text/plain;charset=utf-8;base64,<some_generated_base64_string>",
            "verification": {}
          }
        ]
      }
    },
    "timeouts": {},
    "version": "2.2.0"
  },
  "networkd": {},
  "passwd": {},
  "storage": {},    #<------ alter this section
  "systemd": {}
}

In our script, we’d replace that section with the contents of the base64 encoded static file. The end result should look like this:

"storage": {
    "files": [
      {
        "filesystem": "root",
        "path": "/etc/sysconfig/network-scripts/ifcfg-ens192",
        "mode": 420,
        "contents": {
          "source": "data:text/plain;charset=utf-8;base64,VFlQRT1FdGhlcm5ldApQUk9YWV9NRVRIT0Q9bm9uZQpCUk9XU0VSX09OTFk9bm8KQk9PVFBST1RPPW5vbmUKSVBBRERSPTE5Mi4xNjguMC4xMApQUkVGSVg9MjQKR0FURVdBWT0xOTIuMTY4LjAuMQpETlMxPTguOC44LjgKRE5TMj04LjguNC40CkRFRlJPVVRFPXllcwpJUFY0X0ZBSUxVUkVfRkFUQUw9bm8KSVBWNklOSVQ9eWVzCklQVjZfQVVUT0NPTkY9eWVzCklQVjZfREVGUk9VVEU9eWVzCklQVjZfRkFJTFVSRV9GQVRBTD1ubwpJUFY2X0FERFJfR0VOX01PREU9c3RhYmxlLXByaXZhY3kKTkFNRT0iZW5zMTkyIgpERVZJQ0U9ZW5zMTkyCk9OQk9PVD15ZXMKQVVUT0NPTk5FQ1RfUFJJT1JJVFk9LTk5OQo="
        }
      }
    ]
  },

Note that we’ll create an ignition file for each node, instead of using an ignition file for a node-type as described in the official installation! Also, note that you should modify the append-bootstrap.ign file rather then the bootstrap.ign file itself.

Next, we would encode the entire modified ignitionfile in base64, (just as you normally would) and add it to the guestinfo.ignition.config.data parameter. When the VM boots, it will get a DHCP IP address and it will try to reach the URL defined in the ignition file. If you look in the sample ignition file above, you’ll see it resolves to https://<your_internal_api_loadbalancer>:22623/config/worker. The URL should resolve to the etcd (or bootstrap) node, where ignition downloads some additional configuration and reboots. After booting, it will read the new file you wrote to /etc/sysconfig/network-scripts/ifcfg-ens192 and the static IP Address will be used. If this IP Address is in your company’s DNS, it will also grab the hostname which matches that IP.

Mission accomplished!

We did run into a small issue using this method. The control plane in our scenario was not in the same network as the worker nodes, so a firewall was preventing us from reaching the control plane when booting up worker nodes. We couldn’t figure out why, as we made firewall exceptions for the static IP’s we added. As it turns out, the initial DHCP IP Address obviously didn’t match the static IP’s in the firewall whitelist and access to https://<your_internal_api_loadbalancer>:22623/config/worker was blocked. As a result, the CoreOS Ignition never rebooted and never received the static IP Address (which was whitelisted in the firewall). A real catch-22 as a manual reboot didn’t help either. If you hit this issue, you still have 3 options:

  1. You can use Openshift 4.6 which shouldn’t need the initial DHCP IP Adress
  2. You can whitelist the DHCP IP range in your firewall (which was not accepted in our case)
  3. You can add the IP manually in GRUB as a kernel parameter.

Using option 3 is obviously really cumbersome but this was the only option in our case. While booting the VM, simply hit ‘e’ when the grub menu shows up in the VMware Console. There, change the kernel options and replace

'ip=dhcp,dhcp6' 

to

'ip=<your_ip>::<your_gateway>:<your_subnet>:::none nameserver=<your_nameserver>'

Next, hit CTRL-X and the VM should now boot with the proper IP Address. As this IP Address is whitelisted in your firewall, it will download the proper configuration and reboot. With the reboot your manual kernel parameters will disappear and the file in /etc/sysconfig/network-scripts/ifcfg-ens192 will finally be used.

Hopefully you’ll never need this trick as Static IP support for future Openshift releases should improve.

Installing Openshift Origin (OKD) on AWS – part 3: scale up your brewery!

Featured

In the previous two sessions of this blog series we’ve created an AWS instance and used Ansible to install a single Openshift OKD node. As scalability is one of the key features of cloud, we’ll show you how to add another AWS instance to your cluster. To achieve this, we’ll use Ansible to expand the Kubernetes cluster, without any downtime for your pods.

In this blog post Jan van Zoggel and I focused on installing an all-in-one OKD cluster on a single AWS instance and expanding the cluster with a second AWS instance and manually expanding the cluster with a second AWS instance. This scenario was used for the Terra10 playground environment and this guide should be used as such.

In the previous two blogposts we’ve looked at installing Openshift on a single AWS instance, which is great to get started with Openshift. But what if your developers get excited and start launching lots of Pods? You might hit some performance issues, as this node is also used for the ‘Master’ role which includes hosting the Web console and API’s. Additionally, your master node runs Prometheus and Grafana monitoring out of the box. This is great to get some performance insights but unfortunately those components grab a fair amount of memory.

In this final blog post, we’ll show you how to expand the cluster with a dedicated ‘compute’ node using an additional AWS instance.  Compute nodes are designed to take care of the custom pods your developers create, so you can dedicate your resources on those. By adding multiple compute nodes, you can even ‘evacuate’ Pods from one node to the other in case of maintenance or issues. For now we’ll just focus on one compute node.

To add a second AWS instance, log in to AWS console, hit the ‘launch instance’  button and select Centos 7 from the marketplace. For the instance size the requirements dictate you should have at least 8GB for the compute node, so t3.large would be fine. For the remainder of the wizard you can use the same settings as described in part 1, but be sure to select the same subnet from the dropdown. Also you need to be certain that you’re adding a second disk for Docker. If you’ve added all the ports in the security group as described in part 1, you can select it from the dropdown during the wizard.

Once you have finished the wizard, it shouldn’t take long for the second AWS instance to get a public IP address. Use your AWS key to log in with SSH as we’re now going to preconfigure the host. You could of course re-run all the steps described in part 1 of the blog series, but to make life a little easier, you can also use a script I’ve prepared to run all the preparation steps on Linux:

sudo yum install git
git clone https://github.com/terra10/prepareOKDNode.git
cd prepareOKDNode
./prepareOKDNode.sh

The script installs all packages, configures docker and installs the EPEL release. You’ll find the logfile in /tmp containing all steps. If you hit an error, please type ‘export DEBUG=TRUE’ to print additional logging information.

To grant access from the masternode, please log in to both instances with your AWS key and add the contents of id_rsa.pub from the masternode to the file ‘authorized_keys’ on the newly created node. This step is essential, as Ansible needs to access all hosts in the cluster without prompting for passwords. Also, note the internal AWS hostname for your newly created instance by typing:

hostname

in the SSH session of your new host. You’ll see something like

ip-172-38-10-129.eu-west-3.compute.internal

This is the internal hostname that we can add to our inventory file. Head on over to your master node using SSH and add the following at the end of your inventory file:

[new_nodes]
ip-172-38-10-129.eu-west-3.compute.internal openshift_node_group_name='node-config-compute' '

Once you’ve added the new node to the inventory file, run the following Ansible playbook:

cd ~/openshift-ansible
ansible-playbook ./playbooks/openshift-node/scaleup.yaml

You’ll see that Ansible tries to connect to the second AWS instance and after that several basic pods (for monitoring, the Software Defined Network and some other infra components) are installed onto the new node. When the playbook is done, enter the following on the master node:

oc get nodes

The output should provide you with a list of two nodes, both having the status ‘Ready’. Also, notice that the defined role for the second node is now ‘compute’

get_nodes_scale_blur

As both nodes are now schedulable, your pods will run on either the first or second node. To find out which pods are running on your master node, run

oc describe node <masternode>

Here you’ll see a lot of information, but two things are noticeable here. First, you’ll see that this node is considered ‘schedulable’, which means that new pods are allowed to run on this node. Secondly, you’ll get an overview of all the pods running on your master node. Beside all the default and Openshift pods, you might find some other pods which belong to your developers. If you’ve used part two of this blog series to get here, you’ll find the beerdecision pod on the list.

Of course you want your developers running their pods on the new compute node only, so we’ll have to prevent new pods to hit your master node. Additionally you need to evacuate the pods from the master. Lets start with this first step, by marking our master node as unschedulable:

oc adm manage-node <masternode> --schedulable=false

That’s it! By setting the ‘schedulable=false’, the replication controller knows to avoid this node. You can verify this by hitting the ‘oc get nodes’ command again, which will show you the new status for the mater node.

scheduleDisabledBlurred

Now we’re going to the existing pods around to the new compute node. Lets assume you’ve set up the project described in part 2, simply switch to this project by typing:

oc projects t10-demo

now, see which label is attached to our beerdecision pod:

oc get pods --show-labels

Your output will look something like this:

[centos@brewery ~]$ oc get pods --show-labels
NAME                   READY     STATUS      RESTARTS   AGE       LABELS
beerdecision-1-build   0/1       Completed   0          17h       openshift.io/build.name=beerdecision-1
beerdecision-1-wtvr6   1/1       Running     0          17h       deployment=beerdecision-1,deploymentconfig=beerdecision,name=beerdecision

You can see our running beerpod has the label ‘name=beerdecision’ among other labels. Let’s move this pod to the other node!

oc adm manage-node <masternode> --evacuate --pod-selector=name=beerdecision

And there we go! Your pod is created onto another available node (which in our case can only be the compute node) and it’s removed from the master node. Because Kubernetes uses a Software Defined Network, you don’t need to reconfigure anything on the network level. All pod traffic is handled by the Openshift Router pod.

As you might notice, our master node still has the ‘compute’ role when we type ‘oc get nodes’. To remove this compute role, simply remove the label from the node

oc label node <masternode> node-role.kubernetes.io/compute-

The minus at the end tells Kubernetes to remove the entire label. When you now enter ‘oc get nodes’, you no longer see the compute role defined at your masternode.

relabeledBlurred

And that’s it! All your new pods will be scheduled on the new Openshift node we created during this blog. We’ve also shown how to move your existing beerpod to the new node without downtime. Although this is just a small brewery environment with a limited amount of beer(pods), we’ve tried to demonstrate the scalability of Openshift on the cloud. Using these basic concepts, you can serve as much beers as needed!

Installing Openshift Origin (OKD) on AWS – part 2: How to make a beerdecision

Featured

In this blog series we’re installing Openshift Community Edition (known as OKD, I don’t get it either) on AWS instances based on Centos. In the previous blog post, we’ve set up the AWS instance and used several steps to preconfigure the host. In this part we’ll run the actual Openshift installation using Ansible. To verify that the domain is running, we’ll deploy and scale a simple web application using the web console.

In this blog post Jan van Zoggel and I focused on installing an all-in-one OKD cluster on a single AWS instance and expanding the cluster with a second AWS instance and manually expanding the cluster with a second AWS instance. This scenario was used for the Terra10 playground environment and this guide should be used as such.

The first step towards installing the Openshift cluster is grabbing all the install scripts. Because OKD is open source, you can simply grab these from the official Github page. We’re going to put them in /home/centos/openshift-ansible:

cd ~
git clone https://github.com/openshift/openshift-ansible
cd openshift-ansible
git checkout release-3.11

It’s important to checkout the branch of the version you wish to install, otherwise you’re using the scripts that are currently in development and you’re likely to run into some bugs. We’re using OKD 3.11 which is the latest release at this time (based on Kubernetes 1.11) but if you want to install a different version, just checkout that branch.

Ansible uses several playbooks to install your (single node) cluster, but it also requires an inventory file which contains all your desired hosts and settings. Creating the inventory file can be a bit challenging because there are a lot of variables to choose from. Although there are many online examples, you should be cautious because the available variables change with each OKD release. For example, to set a node as an ‘infra’ node you had to set the ‘region’ as ‘infra’ using the ‘openshift_node_labels’ variable. In the latest release this has changed completely, as you now have to use the ‘openshift_node_group_name’ variable and set it to ‘node-config-infra’. You can find the latest list of variables here, and the blogposts still help to determine some example values.

I’ve used the following inventory file to create the single node domain, and we’ll go through each of these values in more detail below. Replace the file in /etc/ansible/hosts with the following:

# Create an OSEv3 group that contains the masters, nodes, and etcd groups
[OSEv3:children]
masters
nodes
etcd

# Set variables common for all OSEv3 hosts
[OSEv3:vars]
ansible_ssh_user=centos
ansible_become=yes
openshift_deployment_type=origin

# using htpassword authentication on master
openshift_master_identity_providers=[{'name': 'htpasswd_auth', 'login': 'true', 'challenge': 'true', 'kind': 'HTPasswdPasswordIdentityProvider'}]

# disable memory checks on the EC2 host
openshift_disable_check=memory_availability,disk_availability

# set the default subdomain
openshift_master_default_subdomain=apps.brewery.terrax.io

# host group for masters
[masters]
brewery.terrax.io openshift_public_hostname=brewery.terrax.io

# host group for etcd
[etcd]
brewery.terrax.io

# host group for nodes, includes role info
[nodes]
brewery.terrax.io openshift_node_group_name='node-config-all-in-one'

Although you can set many more variables, these covers the basics. The file is divided in several sections, as indicated by the brackets for each section. Let’s start at the OSEv3:vars section.

Ansible_ssh_user is set to either root or a user that belongs to the wheel group, in case of our AWS image we use ‘centos’ as this user is allowed to execute everything out of the box. When you set the ansible_become variable, you tell Ansible that it needs to use ‘sudo’ to run commands. Openshift_deployment_type is set to Origin, as we use the open source version of Openshift.

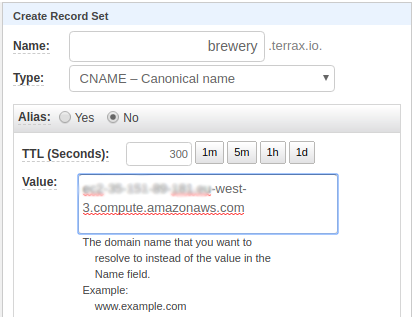
In our playground environment we’re not going to fuss around with LDAP, so we’d like openshift to authenticate against a local htpasswd user. Simply set the openshift_master_identity_providers variable to the specified value, we’ll add the actual user after the installation. Next, we use openshift_disable_check to prevent Ansible to check the memory and disks requirements. This can be useful if you chose the t3.medium instead of the t3.xlarge for budget reasons. The final variable in this section is openshift_master_default_subdomain, which tells Kubernetes that apps run at [projectname]-[appname].apps.brewery.terrax.io. It’s very important that this value matches the wildcard cname you used in the DNS configuration in part 1.

The masters section lists all AWS instances used for the master role in your Openshift cluster. Note that you can set up multiple masters (at least 3 for High Availability), but this involves setting up several other variables and a loadbalancer host. Note that this variable also contains the openshift_public_hostname attribute, which matches the other cname you’ve set up in  the DNS at part 1.

The etcd section in this case points to our master host, as it’s common to co-locate our etcd with our masters. At the ‘node’ section, you specify all your nodes (masters, infra nodes and compute nodes combined) and you use the openshift_node_group_name attribute to specify whether a node has a master, infra, compute or all-in-one role. As we only have one EC2 instance, we’ll pick the latter.

Once you’ve got the inventory file set up, you can start with the prerequisite Ansible playbook. This playbook checks if your config file makes sense and checks the hosts in the files to verify that all required components are set.

cd ~/openshift-ansible
ansible-playbook ./playbooks/prerequisites.yml

Ansible will look at /etc/ansible/hosts by default, use -i to specify another location. Don’t worry if you hit an error while running the playbook, the prerequisite playbook (and the installation playbook to some extend) is rerunnable so you can modify your inventory file and repeat the playbook until you hit the desired result.

The prerequisite playbook should verify that all hostnames and URLs in your inventory are resolvable but be sure that it uses the DNS to achieve this! If you put hostnames in ‘/etc/hosts’ you’ll fool the Ansible scripts, but /etc/resolve.conf is copied inside the containers. As a result, the containers will be unaware of the hostnames and this will cause a fatal error in the installation part. If you’ve got all cnames in the DNS as described in part 1, you should be fine.

If your prerequisite completes you can run the installation playbook:

ansible-playbook ./playbooks/deploy_cluster.yml

This may take a while to complete, as Ansible will now install Kubernetes, create an internal registry, set up multiple internal pods and you’ll even get Prometheus and Grafana monitoring out of the box.

Once you’re done, verify that your ec2 instance is now running as an Openshift node with access to the API by typing the following command:

oc get nodes

This output shows you a couple of things, mainly that:

  1. The oc (or kubectl) command now logs in to your master and can be used to access the cluster.
  2. Your node has status ‘Ready’ and owns the compute, infra and master roles.

oc-get-nodes

Before we can open a browser and access the webconsole, we need to set up the user to login to the cluster. For this playground environment, we’ve specified the htpasswd_auth in the inventory file. Simply set up the admin user like this:

sudo htpasswd -c /etc/origin/master/htpasswd admin

You’ll be prompted to insert a new password. Although this is just a playground, please pick a strong password as this is used to access your public web console. After that, just head over to your web console using the URL you’ve set up in the inventory file! In the example above, this would be:

https://brewery.terrax.io:8443/console

You might hit a certificate error as you haven’t set up certificates yet for this domain. Just ignore the alert and head over to the service catalog.

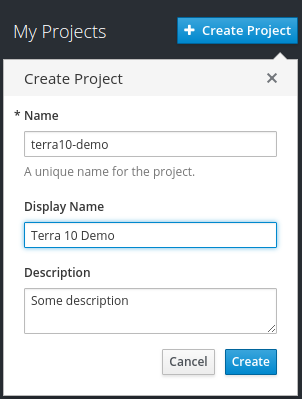
In here, we’re going to create our first project. In the upper right corner, press the blue  ‘Create Project’ button and enter your project name. Hit the Create button when you’re done.

create-project

Next, click your project from the right pane and you’ll automatically go to the dashboard page of your new project. Hit the blue ‘Browse Catalog’ button to add a template.

getStarted

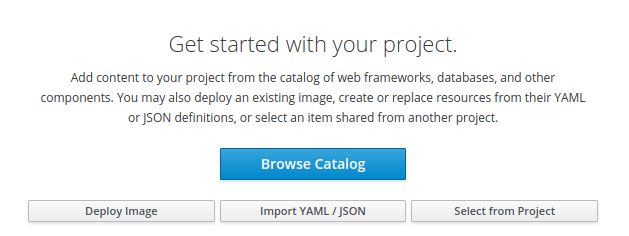
Pick ‘Nginx HTTP server and reverse proxy’ from the catalog. In the dialog screen, click Next. As project name, we’ll use ‘beerdecision’. You can set a lot of settings in this page, but for now we only focus on the Git Repository URL and the Context Directory. Point the Git Repository to:

https://github.com/mhjmaas/beerdecision.git

and set your Context Directory to:

public

That’s all we need, hit next and ignore the binding for now. As you hit ‘Create’, Openshift will connect to Github and the source code for a small React web application is downloaded into a new Nginx container. This might take a few seconds.

rollingDeploy

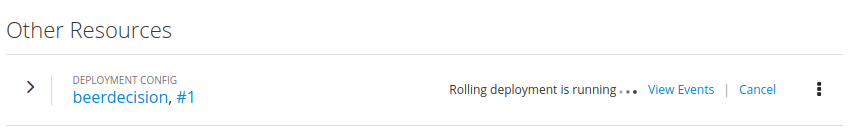
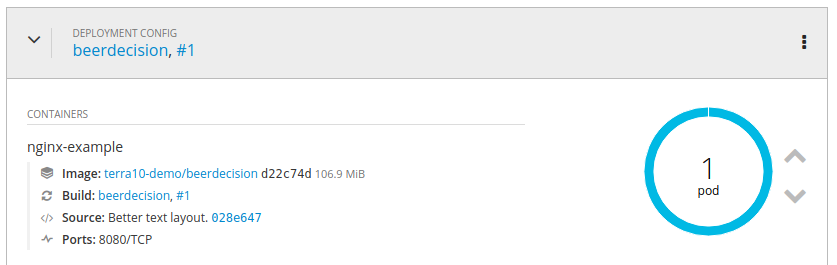
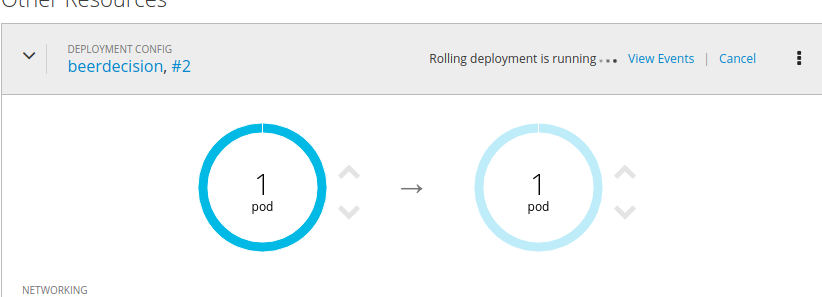
It won’t take long before you see your Pod appear. The blue circle indicates that the Nginx container is ready to handle the traffic. You can use the up and down arrows to increase or decrease the amount of containers Openshift uses to handle the traffic.

firstPod

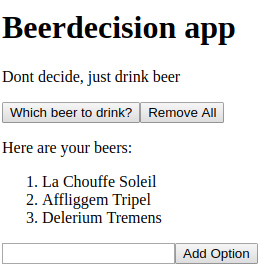
If you’ve used the examples in this guide, your React app should now be available on the following endpoint:

http://beerdecision-terra10-demo.apps.brewery.terrax.io

The app will help you decide what beer to drink! You can add options and the random selection will change as well.

beerdecision-REACT

Pretty cool right? But what if the Git code changes? If the developer decides to make a code change, you can simply hit the ‘start build’ button using the hamburger icon on the right and Openshift will download the latest code from Github into a second Nginx image. Next, all traffic will automatically move to the new pod without downtime for the app users!

rollingDeploy-pod1pod2

So that’s it for this section on the installation of Openshift. We’ve set up a single node cluster on our AWS instance and we’ve even deployed our very first code into a project. In the last section we’re going to add a second AWS instance and we’ll set it up as a compute node to handle all application pods. Stay tuned for part 3!

A special thanks to Marcel Maas for providing the React Git repository for this guide.

Rubix is a Red Hat Advanced Business Partner & AWS Standard Consulting Partner

Installing Openshift Origin (OKD) on AWS – part 1

Featured

Openshift is gaining in popularity, judged by the increasing number of large companies considering Openshift Enterprise as their new container platform. Even though Red Hat offers Openshift as a cloud service, and you can also install Openshift Enterprise on-premise on RedHat Enterprise Linux 7, for this blog post I decided to get my hands dirty with the open source side of the platform. As this guide will show, you can easily enjoy the power of the container platform without any servers or license subscriptions of your own. In a series of three blog posts, we’ll look at installing the open source edition of Openshift, also known as OKD. As open source Linux we picked Centos 7, which is similar to RHEL7.To sweeten the deal, we’ll use the AWS cloud to scale our platform.

In this blog post Jan van Zoggel and I focused on installing an all-in-one OKD cluster on a single AWS instance and expanding the cluster with a second AWS instance manually. This scenario was used for the Terra10 playground environment and this guide should be used as such.

As most readers already know, containers changed the way we release and run applications. There are several benefits to running your applications in containers, but managing and scaling them can be difficult as the number of containers and the amount of docker images grows. Openshift tries to manage these containers with Kubernetes (which is called K8s by the cool kids): the container management layer based on Google’s design. On top of that, Openshift adds several tools such as a build-in CI/CD mechanism, Prometheus monitoring and a nice webconsole if you’re not a fan of the build-in CLI.

For developers that want the basic Openshift experience without the hassle of installing an entire cluster, you can easily install minishift (or minikube if you want to stick to K8s only). In fact, we’ve got some labs to get you started. However, if you’re interested in the installation on multiple hosts so you can play around with High Availability (and you don’t mind diving into the various infrastructure challenges) you’ll have to do an installation.

In blog part 1, we’ll briefly look at setting up AWS instance with Centos 7. Also we’ll look at installing the appropriate packages, configuring Docker Storage, setting up SSH keypairs and setting up the DNS configuration using AWS Route53.

In part 2, we’ll create an inventory file and run the “prerequisite” and “install” Ansible playbooks to set up an all-in-one singlenode cluster. Next, we create a simple user and test with a basic project.

Part 3 of the blogseries will show you how to (manually) configure a second AWS instance, scale out the cluster using a playbook, and move your pods to this second host without any network or DNS changes. (Using the AWS Scaling Group would allow you to add more hosts to your cluster as your load grows, but this is out of the scope of this blog.)

Let’s get started!

Setting up an AWS instance

Creating an instance in AWS is easy. We could use AWS CloudFormation to set up everything as Infra-as-Code but for now we learn more by doing it manually. So just hit the ‘launch instance’ button in the AWS console (assuming you have everything set up), search for Centos in the AWS Market place and choose CentOS 7 from the list. Note that you can also use a RHEL 7 image for this, but additional charges will apply. The official requirements for masters and nodes are pretty high, but you can override the check on this in the installation as we’ll describe in Part 2. For our playground we used t3.medium despite the 4-core minimum warning for co-located etcd and which might also cause some memory-related performance issues. Use t3.xlarge if you want to meet the official requirements.

In the instance detail screen, select a subnet from the dropdown (as your other future instances will have to run in the same subnet) and make sure you have auto-assign Public IP turned ON. All the other settings are adjustable to your own AWS preference  and spending budget, but keep in mind to set a primary IP in the subnet range at ‘eth0’ below. This is just an internal IP used by AWS instances to talk to any future instances you might want to add, as you’ll see in Part 3.

In the ‘Add Storage’ section you get 8gb by default for the root filesystem, though 40gb is required as /var/lib will grow a lot. Also, you should add a second block device with 50gb diskspace for docker storage. In step 6 you can create a security group, default port 22 is enabled for SSH. For security reasons you can select ‘My IP’ in the source dropdown, this way only ssh connections from your current location are allowed. To enable communication with future AWS instances you can add all documented ports to this security group. Note that it’s best practice to use the internal subnet you defined at eth0 as the ‘source’ for these.

When you hit the ‘launch’ button at the end of the wizard you’ll get a PEM key which you can use to connect to your new created instance. Keep this file in a safe spot, as anyone can use it to connect to your instance! After a while you’ll see the public DNS entry appear at your EC2 instance. You’ll need this for the DNS setup. Please note that this DNS entry will change if you shut down your instance.

Setting up the DNS

In this scenario we have one single node to handle all our traffic so this makes our DNS setup fairly easy. In AWS Console, go to Route 53 and set up a hosted zone (e.g. terrax.io). In this hosted zone, add two cname records:

  1. ‘brewery’ (which points to your public DNS entry in the paragraph above)
  2. ‘*.apps.brewery’ (which in this case points to the same public DNS entry as ‘brewery’)

route53-cname-blur

Using the above example cnames, your webconsole will be available at: https://brewery.terrax.io:8443/console
and your pods will run at
[projectname]-[appname].apps.brewery.terrax.io

Setting up the packages on the host

Next, log on to the host using your new SSH key. On Linux and MacOS you can simply run ssh -i [your-key-file] centos@brewery.terrax.io. Note that the centos user comes out of the box when picking the centos image from the AWS marketplace.

Once you’re logged in, run the following commands:

sudo yum -y install centos-release-openshift-origin etcd wget git net-tools bind-utils iptables-services bridge-utils bash-completion origin-clients yum-utils kexec-tools sos psacct lvm2 NetworkManager docker-1.13.1

These will install all required packages on Centos which are mentioned on the prerequisites page of OKD, as well as several missing packages on the Centos 7 image of AWS. NetworkManager should be enabled to be available after reboot:

sudo systemctl enable NetworkManager

Setting up Docker

We installed Docker, but to set up the second disk as docker storage device we need to first find the block device name using lsblk:

​[centos@brewery ~]$ lsblk
NAME MAJ:MIN RM SIZE RO TYPE MOUNTPOINT
nvme0n1 259:0 0 40G 0 disk 
└─nvme0n1p1 259:2 0 40G 0 part /
nvme1n1 259:1 0 50G 0 disk

As the example shows, the empty block device is called ‘nvme1n1’, so we can add easily add it to the Docker storage configuration file:

sudo cat < /etc/sysconfig/docker-storage-setup
DEVS=/dev/nvme1n1
VG=docker-vg
EOF

Next, run the Docker storage setup. This will use the disk you’ve added in the ‘DEVS’ section to create a volume group called ‘docker-vg’:

sudo docker-storage-setup

You can verify that the volume group was created by running ‘sudo vgdisplay’.

Docker is almost ready, we just need to add the following part to the ‘OPTIONS’ line in the /etc/sysconfig/docker file:

--insecure-registry=172.30.0.0/16

For your final step, make sure Docker starts at boot time:

sudo systemctl enable docker

Setup and prepare Ansible

Ansible is not available in the default repository of Centos, so we need to add the EPEL repository. EPEL is short for ‘Extra Packages for Enterprise Linux’ and we can easily add this to Centos with a single command:

sudo yum -y install https://dl.fedoraproject.org/pub/epel/epel-release-latest-7.noarch.rpm

However, we don’t want to use EPEL for all packages, so we’re going to disable the repo file. For the installation of Ansible, we explicitly state that we need EPEL for this package:

sudo sed -i -e "s/^enabled=1/enabled=0/" /etc/yum.repos.d/epel.repo
sudo yum -y --enablerepo=epel install ansible pyOpenSSL

Generating a SSH-keypair

Ansible uses SSH to connect to all hosts in your inventory file, even if you’re only using a single host. To achieve this, you’ll have to set up a SSH-keypair for the centos user so login works without passwords. You already have a SSH-keypair from AWS, but it’s not recommended that you use this! Placing your private (generic) AWS keys on multiple locations is a security hazard. And besides, setting up a separate SSH-keypair is easy:

ssh-keygen -b 4096

Accept all defaults and you’ll find the id_rsa and id_rsa.pub files in the /home/centos/.ssh folder. Next, add the id_rsa.pub to authorized_keys:

cat ~/.ssh/id_rsa.pub >> ~/.ssh/authorized_keys

You can try if it works by trying to connect without a password:

ssh $(hostname)

That’s it for the preconfiguration! In the next part of this blog series, we’ll use this host to run the appropriate Ansible scripts. Stay tuned for Part 2!

Rubix is a Red Hat Advanced Business Partner & AWS Standard Consulting Partner

Advanced MyST Usage: appendvar

Featured

Before we used MyST, I used to put some of the settings I needed in the setUserOverrides.sh script you get out of the box with Oracle Fusion Middleware 12.x products. One of the reasons for this, is that I needed Linux to resolve a $(date) command for my logfile name at boot time. With MyST however, it seemed that I could only add this argument as a startup arg in the weblogic console. The obvious downside here is that Linux cannot resolve the $(date) command this way. I thought this to be a MyST limitation, until someone showed me this trick.

This post is part of a Series in which Maarten Tijhof and I explore the inner and hidden parts of Rubicon Red MyST Studio which might come in handy at times.

Putting startup arguments in the setUserOverrides.sh can have certain advantages. Personally, I find it helpful to put generic startup arguments in the setDomainHome.sh for a domain (such as java heap size), while setting server-specific startup arguments in the arguments field of the Weblogic Console.

There is a hidden feature to fill the setUserOverrides.sh file in your DOMAIN_HOME with certain values, and this trick is called appendvar. Like defining ‘users and groups‘, you can set these values using a specific key-value format in the global variables. First, you need to define the item you want added to the vanilla setDomainEnv.sh. Out of the box, MyST already has an entry for disabling DERBY in 12c blueprints. You can add your entry to this comma seperated list.

patch.custom.appendvar.list (comma seperated list of custom setDomainEnv entries)

--EXAMPLE--
patch.custom.appendvar.list=derby,gclogs

As you can see we added the ‘gclogs’ option to the existing patch.custom.appendvar.list.
Next you need to define the name for each entry and the values for those entries. Note that you can use Linux commands if needed, as this file gets parsed on Linux when the server starts.

patch.custom.appendvar.<item>.name (the name of the argument you wish to set)
patch.custom.appendvar.<item>.value (the value for that argument)

--EXAMPLE--
patch.custom.appendvar.gclogs.name=EXTRA_JAVA_PROPERTIES
patch.custom.appendvar.gclogs.value=$EXTRA_JAVA_PROPERTIES -verbose:gc -Xloggc:$DOMAIN_HOME/servers/$SERVER_NAME/logs/gc_$(date +%Y%m%d_%H%M).log

You can also define for which servers these settings apply. All nodes will get the same setUserOverrides file, but MyST adds ‘if’ statements in the generated setDomainEnv.sh file, so it only applies the arguments to specific servers. By default, all servers (including the AdminServer) get the defined custom startup arguments.  You can change this targeting with the key-value lines below.

patch.custom.appendvar.<item>.target.cluster.list (accepts one or a list of cluster as input, useful if you only want the value applied to managed servers)

patch.custom.appendvar.<item>.target.server.list (alternative to target.cluster.list, uses comma separated list of servers on which you wish to target something)

--EXAMPLE--
patch.custom.appendvar.gclogs.target.cluster_list=osb_cluster
patch.custom.appendvar.derby.target.server.list=AdminServer

The end result will look like this:

--setDomainEnv.sh--
if [ "${SERVER_NAME}" = "AdminServer" ] ; then
    DERBY_FLAG="false"
fi

if [ "${SERVER_NAME}" == "osb_server1" ] ; then
export EXTRA_JAVA_PROPERTIES="$EXTRA_JAVA_PROPERTIES -verbose:gc -XX:+PrintGC -XX:+PrintGCDetails -XX:+PrintGCApplicationStoppedTime -XX:+PrintGCTimeStamps -Xloggc:$DOMAIN_HOME/servers/$SERVER_NAME/logs/gc_$(date +%Y%m%d_%H%M).log"
fi

if [ "${SERVER_NAME}" == "osb_server2" ] ; then
export EXTRA_JAVA_PROPERTIES="$EXTRA_JAVA_PROPERTIES -verbose:gc -XX:+PrintGC -XX:+PrintGCDetails -XX:+PrintGCApplicationStoppedTime -XX:+PrintGCTimeStamps -Xloggc:$DOMAIN_HOME/servers/$SERVER_NAME/logs/gc_$(date +%Y%m%d_%H%M).log"
fi

By default, MyST will now add these entries to the nodes when provisioning a domain, as this is generated at the ‘patch-domain’ phase of MyST.

But what if you already have a domain and want to add these settings? Using an ‘update’ action will not push these values, as ‘patch-domain’ isn’t part of the default MyST update behaviour. You can however run a custom action to push these changes.

On the desired model overview, use the ‘control’ button, then choose ‘custom action’. As ‘action name’, type ‘patch-domain’ and press either enter or tab. Hitting ‘Execute’ will generate the setDomainEnv.sh for you on your Weblogic domains.

custom-action-patchDomain

And that’s it! We hope you find this trick as useful as we did!

Featured

Hidden MyST Features, Part 2

Rubicon Red MyST can provision your Oracle Middelware environments, but it can potentially break existing in-use environments if you don’t know what you’re doing. This tradeoff exists in many provisioning tools, but it’s not necessarily something to be feared. In this post we’ll discuss the impact of various MyST actions, something that has confused many beginning users.

As many readers will know, MyST is very good in provisioning new weblogic-based Oracle platforms such as OSB, SOA and BPM on target nodes. To achieve this, MyST requires various powerful passwords.

First, you need to enter the password (or even better: a long SSH key) of the user you want to use on the OS level. Second, you need the SYS password of the database you want to use. MyST needs this to run the Oracle Repository Creation Utility (RCU) to add the proper schema’s to the database. Additionally, you have to set up the Weblogic password, as this is used to create the domain and to connect to the AdminServer every time you press the update button.

Although these passwords give MyST a lot of power to do the required steps, it can also be used to truncate existing database schema’s, or wipe entire Weblogic domains on the Linux Filesystem. The table below explains the actions available in MyST, the use case for each action and what the impact of each action is on the real-world Weblogic domain and MyST itself. But before we deep-dive in the use cases, we need to elaborate on models vs. instances.

MyST keeps track of the real-world environment by generating an ‘instance’ for each provisioned platform model, which can be a bit confusing. As a matter of fact, most users forget the ‘instance’ button in the MyST Studio interface altogether, as the ‘Models’ view almost shows the same thing. The instance is simply the latest provisioned model. This is important, because many users will expect MyST to always use the latest committed model.

Example: Imagine you provision an OSB DEV environment, which we will call OSBDEV[1.0.0][pr1][pm1]. If you apply a change and commit the model, the model will get version [1.0.0][pr1][pm2], but the provisioned instance will stay at [1.0.0][pr1][pm1] until you either reprovision (and fool MyST by hitting the ‘already provisioned’ checkbox) or press update. As you can see, a drift detection (which compares the instance to the real world) will give a different outcome then an update dry-run (which compares the last committed model to the real world).

Check for Drift

Impact Weblogic domain: No Impact
Impact MyST: No Impact

Use Case: Looking at differences between the real-world Weblogic environment, and the MyST Instance. A report is generated at the end of the action.

Note: MyST will connect to the Weblogic AdminServer and it will create a change lock, but after the drift detection it will cancel the change. If MyST detects an existing change lock by the Weblogic user, it will cancel the drift detection.

Update DRYRUN

Impact Weblogic domain: No Impact
Impact MyST: No Impact

Use Case: looking at the actions MyST will do when someone presses the ‘update’ button. To achieve this, MyST compares the real-world Weblogic environment with the lastest MyST Model. A report is generated at the end of the action.

Note: MyST will connect to the AdminServer to create a changelock, but it will be cancelled when the action is completed.

Override State

Impact Weblogic domain: No Impact
Impact MyST: Impact (state only)

Use Case: In rare cases, your model will show an incorrect MyST state, in which you cannot perform certain actions. By overriding the state, you can let MyST think an environment is functioning properly, which allows for example the update action.

Reprovision (ALREADY PROVISIONED checkbox)

Impact Weblogic domain: No Impact
Impact MyST: Impact

Use Case: This action can be very useful, as it updates the MyST instance to the latest committed model version. This way, MyST thinks that this model version is already present in the real world. When you have an existing Weblogic environment, you can manually create a blueprint/model for this environment and use ‘Reprovision ALREADY REPROVISIONED’ to let MyST create an instance for this model. Next, you can use Drift detect to see if your model is correct.

Note: MyST will connect to the AdminServer host and verify that the aserver domain is present.

Update

Impact Weblogic domain: Impact
Impact MyST: Impact

Use Case: This action is used most often and it pushes the MyST configuration changes from the latest committed model to the real world Weblogic environment. To do this, MyST uses the Weblogic username and password to connect to the AdminServer, it creates the change lock and applies all changes. Then the change is activated. If this fails, all changes in the weblogic console are rolled back.

To prevent this behaviour, first reprovision the model with ALREADY PROVISIONED on true. Next, use the ‘control’ button, then choose ‘custom action’. As ‘action name’, type ‘update’ and press either enter or tab. for ‘additional arguments’, use ‘-Ddo.not.rollback’.
Hit execute.

custom action

This will perform the update again, but when the session activate fails, MyST will simply disconnect, allowing you to login to the weblogic console and analyse any errors. In my experience, sometimes it helps to hit ‘save’ on a certain configuration item in the weblogic console, to see the root issue that is not shown either in MyST or the Weblogic log.
Note that this custom action applies all differences between the real-world environment and the instance, that is why you need the provision – already provisioned action.

Reset Drift

Impact Weblogic domain: Impact
Impact MyST: Impact

Use Case: This action will perform the same as an update.

Reprovision

Impact Weblogic domain: Impact
Impact MyST: Impact

Use Case: This action will re-install your entire environment! All existing schema’s will be removed and re-created. All domain configuration (expect for the oracle-home) on the target hosts will be removed. This action is useful for re-installing test environments that need to be clean. Never use this action in a mission-critical environment, unless you use the ‘already provisioned’ checkbox (see above).

Note: MyST runs the RCU to remove and create the schema’s required for the involved Oracle products. If you have other schema’s in the defined RCU database or other databases defined in datasources, these will not be affected.

Terminate

Impact Weblogic domain: Impact
Impact MyST: Impact

Use Case: This action will remove the real-world environment, by removing all existing schema’s created by RCU and by removing all domain configuration (except for the oracle-home) from the target hosts.

Featured

Hidden MyST Features, Part 1


Provisioning and Maintaining your Oracle Fusion Middleware domains is pretty straigthforward when you’re using Rubicon Red MyST. The MyST Studio graphical user interface has gotten a lot better in the last couple of years, and is still actively developed today. In this blog series we’ll cover some Rubicon Red MyST features which are more advanced, and not always straight-forward. We’ll start easy, with some tricks.

Most of the readers looking into these tricks will know very well what MyST can offer and how it is beneficial. If however you’re new to MyST, let me briefly explain what it can do.

Rubicon Red MyST is a tool for provisioning and maintaining various Oracle Middleware products. It focusses mostly on Oracle OSB, SOA and BPM, but also supports other products, such as versions of BI Publisher, Webcenter Content and even simple weblogic or webtier installations. It uses the concept of blueprints and models, in which blueprints contain generic (environment-independent) settings and models inherit these settings to make them environment-specific.

Imagine for example an Oracle SOA installation in which DEV, TEST and PROD use the same listen port (which you set in the blueprint), but different SOA-INFRA database urls (which you set in the model).

As this is relatively easy to do, there are some more advanced tricks which you cannot find in the documentation.

Questionmarks:

If you set up a question mark as a value for a config item, MyST will remind you to set the actual value, when you are trying to run a reprovision or update of a specific model. The reprovision or update will fail and the log will display that the value needs to be set first before MyST can run. This can be usefull in various ways:

  1. Force passwords. You can set up a datasource in the blueprint, but as the password is always hidden, you won’t see that the password is not set or set incorrectly at the model level. By setting the password on a blueprint as a questionmark, you cannot roll out the model unless you overwrite that question mark with the actual password.
  2. Force endpoints. Although Database URL’s, SAF Remote Contexts and loadbalancers vary per model, you can set these values as a questionmark on the blueprint level, reminding the model-maker to set these values before continuing.

Another small trick: If you’re creating your own Global Variable and want to set a password, just use the word ‘password’ as part of the variable name. This way, MyST Studio will recognize that this is a sensitive value and after hitting ‘save’, your value will appear hidden.

Also, consider changing the db-sys-password value to some invalid text after the initial provisioning. This will prevent accidental termination of the database schema if you press the wrong button with a mission-critical environment.

Adding Users & Groups

Sometimes It’s necessary to add users and/or groups to the internal LDAP of weblogic. As of version 6.4 there is no section in the configuration screen dedicated to this. To add users, you have to get into the Global Variables section of your configuration.
If the user(s) you want are generic for all environments. You can do the following in the global variables of the Blueprint:

add.users (Comma separated list of users you want to add)

--EXAMPLE-- 
add.users=user1,user2

This section tells MyST you want to add users to the domain. Of course you need to specify these users:

USERNAME.password  (Password for USERNAME)
USERNAME.group  (optional group(s) you want to set for USERNAME)
USERNAME.description  (Description as shown in Weblogic)

--EXAMPLE--
user1.password=?
user1.group=Monitors,IntegrationOperators
user1.description=OPS user

The same can be applied for groups, in a similar fashion:

add.groups (Comma separated list of groups)
GROUP.description (Description as shown in Weblogic)

--EXAMPLE--
add.groups=group1,group2
group1.description=OPS users
group2.description=DEV users

Using Global Variables in strategic places

MyST can be a bit repetitive for some parts, as you might need to repeat certain configuration items for each model over and over again. Imagine you have 2 datasources which go to the same database, but each use a different user. To set this up, you can configure the datasources at blueprint level but you would still need to set up URL and password at the model level. If you have 4 environments, you need to enter the database url field 8 times, and that’s just for 2 datasources!

One trick to save you some time is to create a custom global variable on the blueprint. You can name this variable any way you like, and set the value to a questionmark.

--EXAMPLE--
db.sales=?

Next, hit save and copy the name of the variable you created

copyGlobal

Within the same blueprint, now navigate to the two datasources. Because URL is usually not set on the blueprint level, you have to hit ‘show advanced properties’ on the top right to see it. In this field, paste the ${var.db.sales} variable field. As you hit the calculator in the top of the configuration panel, you’ll see that the resolved value now shows as the questionmark you’ve set earlier

resolvedValue

This now means two things:

  1. At the model level, all you need to do is to overwrite the contents of global variable db.sales, and replace the questionmark with the specific database URL of that environment. This URL is then automatically used in all datasources which contain ${var.db.sales} in the URL field. You only need to set this URL once per model now.
  2. The questionmark which you set at the start works as a fail-safe. Provisioning or updating the model without overwriting the variable will throw an error, which prevents someone to provision a datasource with a non-existing database.

This concludes the MyST tricks for this round, we’ll post more advanced tricks in the future!


Traffic to multiple Openshift Clusters, a NodePortService usecase

In my previous post I’ve described how you can set up multiple infranodes with multiple ingresscontrollers, just in case you have to deal with some existing networks. But what if you’re perfectly happy with the default ingress controller and instead.. you want to spread out your traffic on to multiple Openshift clusters? This blogpost describes how to set up multiple ingress controllers on the same infranodes using the NodePortService Strategy.

The challenge sounds rather simple. Imagine having two Openshift clusters: cluster1 and cluster2. These clusters are not aware of each other in any way and they simply run their own workloads.

You can simply add a third loadbalancer and call it *.apps.hacluster.yourdomain and forward all 443/tcp traffic to those 4 infranodes right?

Unfortunately the wildcard certificate breaks in that case!
Any requests sent to *.apps.hacluster.yourdomain would be answered by the ingresscontroller from either cluster1 or cluster2. This means you’ll get a response from domain *.apps.cluster1.yourdomain or *.apps.cluster2.yourdomain.
This doesn’t match your browser URL and you’ll get an insecure certificate warning.

OK what’s next? You could replace the default wildcard certificate on both clusters to match *.apps.hacluster.yourdomain but this would break traffic going to a specific cluster. For example, the console from a specific cluster is also hosted on *.apps.cluster1.yourdomain.

Ok maybe add a second ingress controller on the same infranode? You could do this using the yaml in my previous blogpost but you’ll see an error rather quickly: the default ingress controller already uses port 443 and your new ingresscontroller cannot push any router pods because this port is already in use.

Using a second ingresscontroller on the same infranode however can be achieved if you’re able to set up a different port next to 443. Take a look at this image:

As you can see we can set up an ingres controller which listens to port 32443 while the default ingress controller will stay the same (with it’s own wildcard certificate) on port 443. To do this, apply the following yaml:

apiVersion: operator.openshift.io/v1
kind: IngressController
metadata:
  name: hacluster
  namespace: openshift-ingress-operator
spec:
  domain: apps.hacluster.yourdomain
  endpointPublishingStrategy:
    type: NodePortService
  nodePlacement:
    nodeSelector:
      matchLabels:
        node-role.kubernetes.io/infra: ""
  routeAdmission:
    namespaceOwnership: InterNamespaceAllowed
  routeSelector:
    matchLabels:
      my/loadbalancer: hacluster

The operator will now do tree things: router pods are scheduled on the infranodes, a secret is generated with the name ‘router-certs-hacluster’ and you’ll get an extra service: router-nodeport-hacluster. As stated in the previous blogpost, this secret is a useless placeholder as it contains a wildcard certificate signed by the operator.

To fix the secret with your own ‘hacluster’ wildcard certificate, use

cat <hacluster wildcard certificate> <intermediate certificate> <root certificate> > hacluster.crt
oc delete secret/router-certs-hacluster -n openshift-ingress
oc create secret tls router-certs-hacluster --cert=hacluster.crt --key=hacluster.key -n openshift-ingress

The service ‘router-nodeport-hacluster’ is generated by the NodePortService strategy and it’s a tiny service which allows us to do our magic. It is designed to expose a random port from the node to the new ingress controller, allowing you to put as many* ingress controllers on this infranode without port conflicts. If you don’t like the randomized port, you can change it by setting

oc patch service router-nodeport-hacluster --type json -p '[{"op": "replace", "path": "/spec/ports/1/nodePort", "value": 32443}]' -n openshift-ingress

or use the GUI to change the random portmapping from inside the router-nodeport service:

and that’s it! Any traffic to port 32443 will reach the new ingress controller and the attached routes will receive traffic. Note that the ingress controller yaml has a routeselector with my/loadbalancer: hacluster.
This means only routes with this label are attached to the newly created ingress controller.

Also make sure your ‘hacluster’ loadbalancer uses sticky sessions if you have any https endpoints running with state.

Happy ingressing!

Setting up multiple Ingress Controllers on Openshift 4.x

When installing Openshift on-premise or in the cloud, by default you’ll get a single ingress controller. It’s the well known ‘*.apps ingress controllers and it forwards all traffic from *.apps.yourcluster.yourdomain to the pods. However for our installation we needed multiple ingress controllers. In other words, we had multiple entry points to our cluster, ranging from *.management for the console, to *.dev and *.prod for our various workloads. You can set this up but it’s not part of the vanilla installation. Also, setting it up required some fiddeling with the default wildcard certificates.

You might wonder why someone would need this?
For example, out of the box you can perfectly set up all routes on the default ingress controller. The routes would look like: frontend-dev.apps.yourcluster.yourdomain, frontend-prod.apps.yourcluster.yourdomain etc. This would all fit within the default ingress controller and it’s all covered with your wildcard certificate.
However in our case we were dealing with multiple (seperated) networks. The controlplane was installed on network A, the DEV infranodes and workers needed to be installed on network B and the PROD workload needed to be installed in network C. Even though the cluster is stretched on top of those networks and all pods can talk directly though the SDN, ingress traffic was expected to come in at the corresponding network level. As infranodes are not part of any subscriptions, you can build as many as you need!

This image describes our situation. Please note that this overview is fictional and only proves the purpose of this setup.

First we needed to rename the default ingress controller. You need to do this before you install your cluster, as this cannot be renamed afterwards! When first running the installation for openshift 4.x, you will create some manifests using

./openshift-install create manifests --dir=<installation_directory>

After you get these manifest files, go to the folder ‘manifests’ inside the installation_directory and edit the file ‘cluster-ingress-02-config.yml’. In here, set your ‘domain’ value to match your new default ingress controller value. You can find the link to the Red Hat support article here. After adjusting the file, you can run the next step of the installer. Make sure you set up dedicated infranodes using this guide.

Next, when you have your cluster you need to label the infranodes. Lets assume you label the infranodes ‘my/zone=management’, ‘my/zone=dev’ and ‘my/zone=prod’ for the management, dev and infranodes respectively. Out of the box, the ingresscontroller will push router pods on all infranodes, but you don’t want this, as *.management traffic is only allowed on the orange ‘my/zone=management’ infranodes shown above. To fix this, patch your default ingress controller:

oc edit ingresscontroller default -n openshift-ingress-operator -o yaml

and set

spec:
 nodePlacement:
  nodeSelector:
   matchLabels:
    node-role.kubernetes.io/infra: ""
    my/zone: management

you can check if the default router pods are only running on the ‘management’ infranodes by running

oc get pods -n openshift-ingress -owide

Now for the fun part.. setting up additional ingress controllers. Take a look at this ingresscontrollers.yaml file:

apiVersion: v1
items:
- apiVersion: operator.openshift.io/v1
  kind: IngressController
  metadata:
    name: dev
    namespace: openshift-ingress-operator
  spec:
    domain: dev.yourcluster.yourdomain
    nodePlacement:
      nodeSelector:
        matchLabels:
          my/zone: dev
          node-role.kubernetes.io/infra: ''
    routeSelector:
      matchLabels:
        my/env: dev
    routeAdmission:
      namespaceOwnership: InterNamespaceAllowed
- apiVersion: operator.openshift.io/v1
  kind: IngressController
  metadata:
    name: prod
    namespace: openshift-ingress-operator
  spec:
    domain: prod.yourcluster.yourdomain
    nodePlacement:
      nodeSelector:
        matchLabels:
          my/zone: prod
          node-role.kubernetes.io/infra: ''
    routeSelector:
      matchLabels:
        my/env: prod
        routeAdmission:
      namespaceOwnership: InterNamespaceAllowed

This will create two additional ingress controllers: ‘dev’ and ‘prod’ in the ‘openshift-ingress-operator’ namespace. The ‘domain’ section for each ingress controller matches the FQDN on the loadbalancer (with the wildcard CNAME) and the router pods are only pushed to the infra nodes with the proper label.

To apply these ingress controllers, use

oc apply -f ingresscontrollers.yaml

To view your ingress controllers, type

oc get ingresscontroller -n openshift-ingress-operator

(this might seem confusing, as your actual router pods are pushed to ‘openshift-ingress’ instead of ‘openshift-ingress-operator’.

by default, some secrets are created containing wildcard certificates for these new ingress controllers. As these are signed by the ingress operator, they’re probably not valid inside your organisation. To replace them, run

cat <dev wildcard certificate> <intermediate certificate> <root certificate> > dev.crt
oc delete secret/router-certs-dev -n openshift-ingress
oc create secret tls router-certs-dev --cert=dev.crt --key=dev.key -n openshift-ingress

repeat this step for your prod wildcard certificate.

Now that you have set up each ingress controller on their own set of infranodes, you are almost done. There is one thing you need to do. If you create a route for e.g. your frontend webserver, the route will attach itself to each ingress controller. You might have seen the section in the yaml that is designed to prevent this:

 routeSelector:
   matchLabels:  
     my/env: prod 

By creating routes with ‘my/env=prod’, you are certain that the route is accepted by the prod ingress controller. However, the default ingress controller doesn’t have a ‘routeSelector’ and will accept any route! To make sure the route is only exposed on the ingress controller you want, patch the default ingress controller to ignore routes with ‘my/env=dev’ or ‘my/env=prod’ labels:

oc patch --type=merge -p '{"spec":{"routeSelector":{"matchExpressions":[{"key":"my/env","operator":"NotIn","values":["dev","prod"]}]}}}' ingresscontroller default -n openshift-ingress-operator

And that’s it! any out-of-the-box route is now exposed in the orange ‘ops’ network and any route with a dev or prod label is exposed on the proper corresponding network.

In my next blogpost I’ll describe how to set up additional ingresscontrollers on the same infranodes using nodeportservices. The goal there is to get traffic into multiple Openshift clusters.

Adding USB devices to your containers

While this seems an uncommon scenario, it’s very usefull to add USB devices to your containers. Imagine running Home Assistant in your container and having a Z-wave or Zigbee USB stick in the container host. There are multiple ways to add this, and it can be a bit confusing if you don’t know the difference between the various methods. In this blog I’ll descibe two ways of setting up USB devices to your container.

The first method is by far the easiest: simply add ‘privileged: true’ to your docker-compose file or add –privileged as a flag to the docker run command. This allows the container to access all components of the host which runs your docker runtime engine. Obviously this is not preferred, as your container can reach every block device on your system and could even reach passwords kept in memory. If you don’t care about this level of security, this method is by far the easiest solution.

The second method is much more secure but this can be a bit confusing. Simply add the device you need (e.g. /dev/ttyUSB1) as a virtual device inside your container. In docker compose this looks like this:

devices:
  - /dev/ttyUSB1:/dev/ttyUSB1

Note that this is a simple mapping, using <actual_path_on_host>:<virtual_path_in_container>. To keep things simple here, we used the same virtual path as the actual path. Easy right? There is a drawback here: Linux will randomly generate the devicename of your USB stick on reboot or after adding a USB stick. This is why you should never add a /dev/<device> directly, but rather use the symlinks which contain a unique identifier for your USB device.

Let’s take a look at my ZZH! stick on the docker host. Using ‘dmesg’ you can see it’s mapped to ‘ttyUSB1’

[1199309.256461] usb 2-1.2: New USB device strings: Mfr=0, Product=2, SerialNumber=0
 [1199309.256463] usb 2-1.2: Product: USB Serial
 [1199309.256893] ch341 2-1.2:1.0: ch341-uart converter detected
 [1199309.257777] usb 2-1.2: ch341-uart converter now attached to ttyUSB1

so you can find it at /dev/ttyUSB1. However this can change randomly as stated above, so rather let’s look at /dev/serial/by-id

ls -lthra /dev/serial/by-id
total 0
drwxr-xr-x 4 root root 80 Dec 20 16:46 ..
lrwxrwxrwx 1 root root 13 Dec 20 16:46 usb-0658_0200-if00 -> ../../ttyACM1
lrwxrwxrwx 1 root root 13 Dec 20 16:46 usb-RFXCOM_RFXtrx433_A1YUV98W-if00-port0 -> ../../ttyUSB0
lrwxrwxrwx 1 root root 13 Jan 3 13:54 usb-1a86_USB_Serial-if00-port0 -> ../../ttyUSB1
drwxr-xr-x 2 root root 100 Jan 3 13:54 .

here you can see I have multiple USB adapters connected, and

/dev/serial/by-id/usb-1a86_USB_Serial-if00-port0

is the device which always points to my ZZH! stick.
So let’s add this symlink to the docker compose file and to prevent confusion, let’s rename the target virtual mapping inside the container:

devices:
  - /dev/serial/by-id/usb-1a86_USB_Serial-if00-port0:/dev/Virtual_ZZH_stick

Now the container will have a “/dev/Virtual_ZZH_stick” device which automatically maps to the actual USB stick, even after reboot or swapping USB ports. Note that any configuration you might have in the container, must now point to /dev/Virtual_ZZH_stick. For example, my zigbee2mqtt container will now have:

serial:
  port: /dev/Virtual_ZZH_stick

Note that you could add both methods 1 and 2 above, but it would make little sense: using privileged: true you wouldn’t need any device mappings and such it seems to be ignored during my many debugging hours. As such, I’d recommend the following:

  1. after plugging in your usb stick, run ‘dmesg’ to see which mapping it contains.
  2. add privileged: true to see if the container can reach the device. If this is not the case, check if the privileges are set properly on the /dev/<mapping> location. You could temporarily set ‘chmod 777 /dev/<mapping>’ to see if this fixes your issue.
  3. If the container can reach the device, remove privileged: true from your container configuration and use the device mapping as suggested by device 2.

Advanced MyST Usage: EM Console tuning

Every Oracle Fusion Middleware Administrator wil recognise the complaint: EM Console is slow. The reason for this can differ, but it is most often caused by lots of composites which are deployed on your SOA-INFRA and the Admin Console collecting metrics on all of them. Oracle Support discusses this issue in Doc ID 1423893.1, in which they explain how to set various mbeans to cache certain EM metrics. Settings these mbeans has to be done through the cumbersome mbean tree. But what if I told you MyST can do it for you?

This post is part of a Series in which Maarten Tijhof and I explore the inner and hidden parts of Rubicon Red MyST Studio which might come in handy at times.

In Oracle Fusion Middleware SOA Suite, the Enterprise Manager is used to show composites, metrics and (if desired) even the composite instances with or without payload. Collecting all these values puts a lot of load on your AdminServer and it is not uncommon for the Enterprise Manager Console to take a very long time to log in. Especially when the amount of composites and the payload grows, logging in to EM can become quite a pain.

Oracle addresses this issue by giving you certain mbeans to tune the EM Console. Most of these mbeans concern caching certain displayed results so that the login becomes much faster after building up the cache. Unfortunately, the first user to log in is still stuck with the slow login time, as this time is used to build the actual cache.

Of course you can manually set the mbeans without MyST, just use Doc ID 1423893.1 and follow the steps to add the appropriate mbean values in the Mbean browser. You’ll be looking for the emoms.props bean. Once you found it, hit ‘properties’ and some default key-value pairs are shown.

emoms_props_before_tune

As described in the Oracle Documentation, you’ll need to add some fixed key-value pairs to the list shown above. You can do this using ‘setProperty’ on the ‘Operations’ tab. Repeat the invocation for each of the four key-value pairs described in the document and you should be all set. Note that this has to be done for each EM Console you wish to tune, so you can imagine why this is cumbersome.

However if you have MyST, all you need to do is add these properties to the Global Variables of the Platform Blueprint. This way, you only have to set the desired tuning values once and they will be used on all models that inherit from that blueprint. Simply click the blueprint and hit ‘Edit Configuration’. In the Global Variable section, press ‘bulk edit’ to add the properties listed below. Hit ‘save’ or ‘save and commit’ on your blueprint to save your changes, you no longer have to save the bulk change seperately. The list below describes the properties you need and what they do:

--enable caching for FMW Discovery data--
oracle.sysman.emas.discovery.wls.FMW_DISCOVERY_USE_CACHED_RESULTS=true

--sets how long the cache is valid in millisec, below is 30 days--
oracle.sysman.emas.discovery.wls.FMW_DISCOVERY_MAX_CACHE_AGE=2592000000

--sets a timeout for a running discovery when a new user logs in
oracle.sysman.emas.discovery.wls.FMW_DISCOVERY_MAX_WAIT_TIME=1800000

--skip certain metrics (and big SQL statements) so login is faster--
LargeRepository=true

The tuning of the EM console is now added out-of-the-box for each new environment you provision based on this blueprint! But what about existing models?

First, select your model and run the ‘update’ command. Although you will not see any changes in the log, this changes your MyST instance so that it will use the new global variables in the future. In case you’re dealing with a 12c environment, you need to run a custom action on the same model and use ‘configure-soa’ as the action. Don’t forget to hit the ‘tab’ key, otherwise the command won’t stick. In 11g environments this step can be skipped because the ‘configure-soa’ command is part of the ‘update’ procedure.

action_to_perform

Hit Execute and you should see the following in the MyST logs:

MySTLog

And you’re done! Note that these instructions closely resemble the method of setting mbeans on your MyST environments, as described by Maarten. However, setting mbeans has to be done on the ‘SOA Product’ section in MyST, whereas the EM Tuning parameters have to be added to ‘Global Variable’ section.

We hope these instructions will save you a lot of time, clicking though the mbean browser and especially logging into EM.